PowerBI | ATLIQ REVENUE ANALYSIS
Dynamic Revenue Analysis for Atliq Grands Hospitality in May 2022 - July 2022

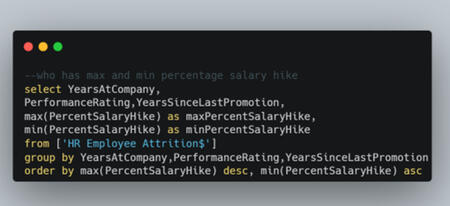
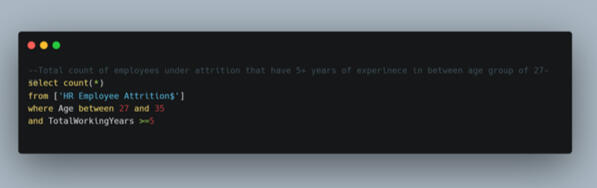
SQL | HR EMPLOYEE ATTRITION
Exploring Employee Attrition with SQL: uncovering valuable insights for a stronger workforce
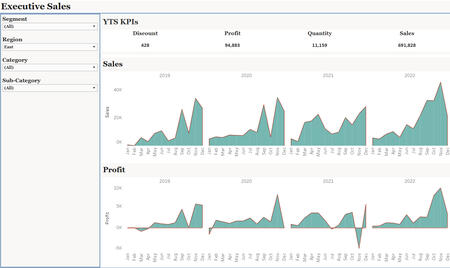
TABLEAU | EXECUTIVE SALES DASHBOARD
Visualizing Sales Performance with Tableau: A Comprehensive Executive Dashboard
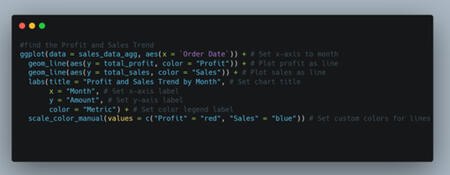
R | SAMPLE SUPERSTORE SALES ANALYSIS
Uncovering Insights from Sales and Profit Analysis of Sample Superstore using R
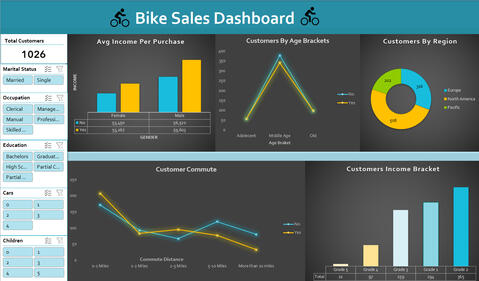
EXCEL | BIKE SALES DASHBOARD
Tracking Bike Sales Trends in Real-Time: An Interactive Excel Dashboard
PowerBI-
ATLIQ REVENUE ANALYSIS
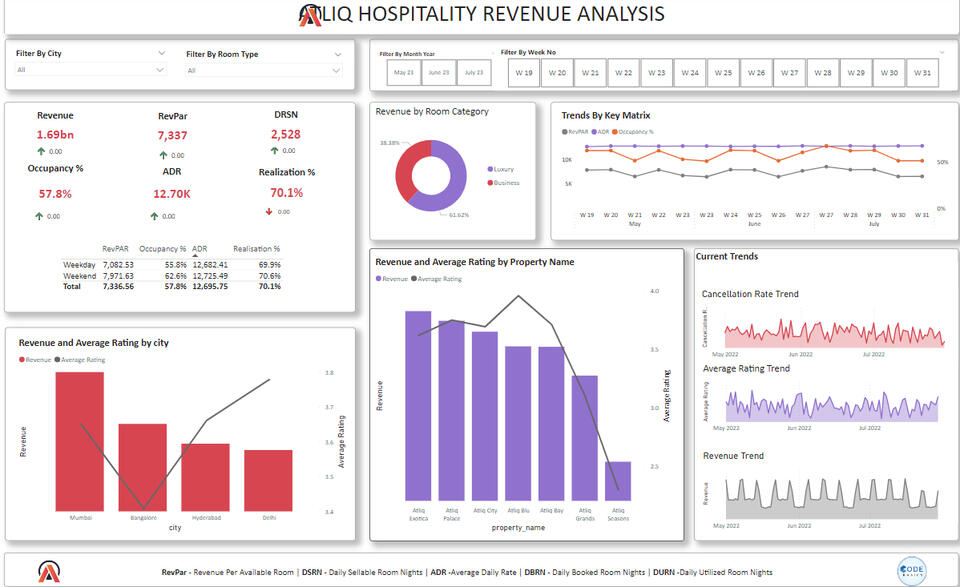
AtliQ Grands owns multiple five-star hotels across India. They have been in the hospitality industry for the past 20 years. Due to strategic moves from other competitors and ineffective decision-making in management, AtliQ Grands are losing its market share and revenue in the luxury/business hotels category. As a strategic move, the managing director of AtliQ Grands wanted to incorporate “Business and Data Intelligence” to regain their market share and revenue. However, they do not have an in-house data analytics team to provide them with these insights.
I am doing analysis as 3rd party service provider to provide them with insights from their historical data.Key Takeaways
1. The findings indicate that both the Luxury and Business categories are experiencing a decline in revenue at a similar rate. Furthermore, the data shows that revenue has been consistently decreasing since week 29.
2. The data analysis reveals that Atliq Exotica is the most profitable property, and Mumbai is the most profitable city. This inference is drawn based on the revenue generated from these locations.
3. The data suggests that hotel rooms are more frequently occupied on weekends compared to other days of the week. However, customer feedback remains relatively consistent across all days, indicating that customer satisfaction does not vary significantly based on the day of the week.
4. It is observed that Delhi generates the least revenue among the categories but has a higher average rating. This indicates that despite lower revenue, Delhi performs well in terms of customer satisfaction.
5. On the other hand, Atliq Seasons has lower ratings on average. This finding suggests a need for further observation and analysis to understand the reasons behind the lower ratings and identify potential areas for improvement.What I used to manipulate data
-Power query
- Data cleaning
- Data modelling
- Building metrics using dax
- Calculated columns
- Measures
- Conditional formatting
- Tooltip
The dashboard is fully dynamic and changes based on the filter option using the slicer.
SQL | HR EMPLOYEE ATTRITION
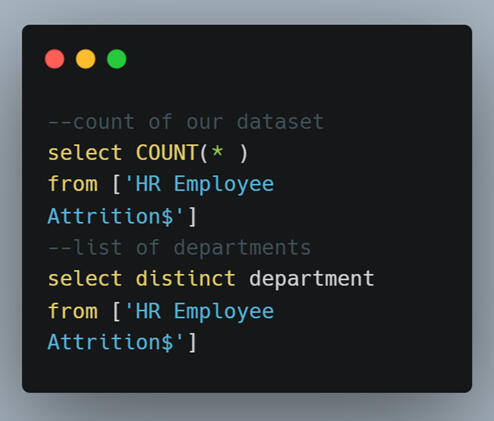
There are 1470 employee's recorded